mirror of
https://github.com/eko/pihole-exporter.git
synced 2024-11-24 11:37:03 +01:00
A Prometheus exporter for PI-Hole's Raspberry PI ad blocker
| config | ||
| internal | ||
| .gitignore | ||
| .travis.yml | ||
| dashboard.jpg | ||
| go.mod | ||
| go.sum | ||
| LICENSE | ||
| main.go | ||
| README.md | ||
PI-Hole Prometheus Exporter
This is a Prometheus exporter for PI-Hole's Raspberry PI ad blocker.
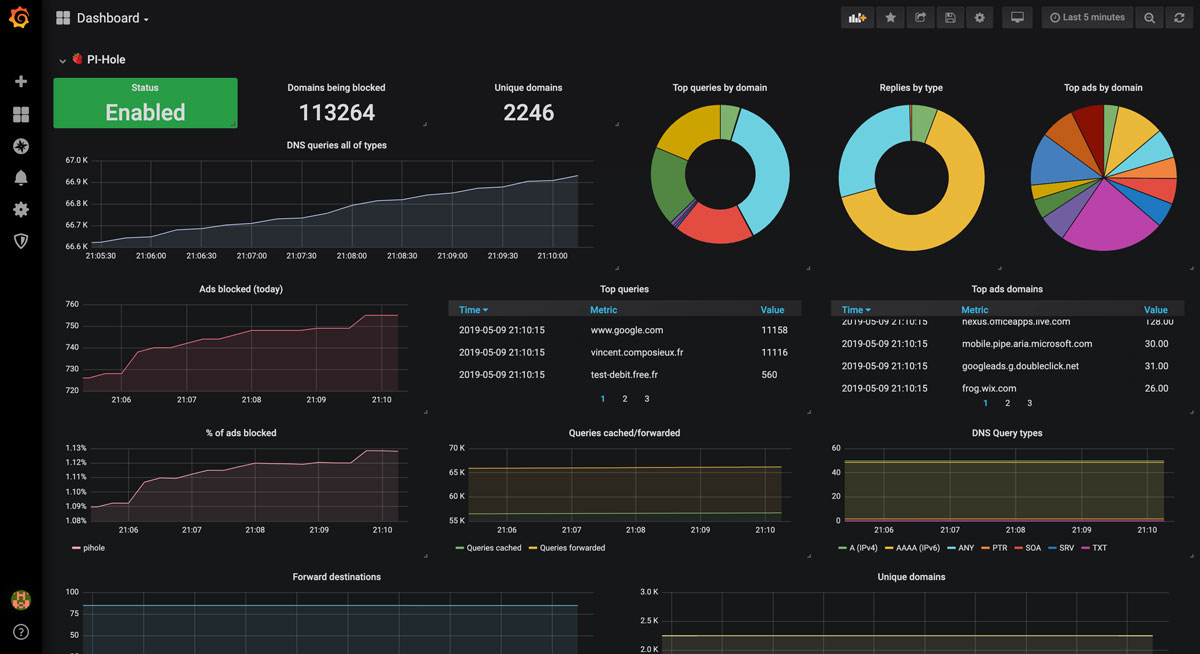
Grafana dashboard is available here.
Prerequisites
Installation
Download binary
You can download the latest version of the binary built for your architecture here:
- Architecture i386 [ Darwin / Linux / Windows ]
- Architecture amd64 [ Darwin / Linux / Windows ]
- Architecture arm [ Linux ]
From sources
Optionally, you can download and build it from the sources. You have to retrieve the project sources by using one of the following way:
$ go get -u github.com/eko/pihole-exporter
# or
$ git clone https://github.com/eko/pihole-exporter.git
Then, build the binary (here, an example to run on Raspberry PI ARM architecture):
$ GOOS=linux GOARCH=arm GOARM=7 go build -o pihole_exporter .
Usage
In order to run the exporter, type the following command (arguments are optional):
$ ./pihole_exporter -pihole_hostname 192.168.1.10 -pihole_password azerty

2019/05/09 20:19:52 ------------------------------------
2019/05/09 20:19:52 -  PI-Hole exporter configuration  -
2019/05/09 20:19:52 ------------------------------------
2019/05/09 20:19:52 PIHoleHostname : 192.168.1.10
2019/05/09 20:19:52 PIHolePassword : azerty
2019/05/09 20:19:52 Port : 9311
2019/05/09 20:19:52 Interval : 10s
2019/05/09 20:19:52 ------------------------------------
2019/05/09 20:19:52 New Prometheus metric registered: domains_blocked
2019/05/09 20:19:52 New Prometheus metric registered: dns_queries_today
2019/05/09 20:19:52 New Prometheus metric registered: ads_blocked_today
2019/05/09 20:19:52 New Prometheus metric registered: ads_percentag_today
2019/05/09 20:19:52 New Prometheus metric registered: unique_domains
2019/05/09 20:19:52 New Prometheus metric registered: queries_forwarded
2019/05/09 20:19:52 New Prometheus metric registered: queries_cached
2019/05/09 20:19:52 New Prometheus metric registered: clients_ever_seen
2019/05/09 20:19:52 New Prometheus metric registered: unique_clients
2019/05/09 20:19:52 New Prometheus metric registered: dns_queries_all_types
2019/05/09 20:19:52 New Prometheus metric registered: reply
2019/05/09 20:19:52 New Prometheus metric registered: top_queries
2019/05/09 20:19:52 New Prometheus metric registered: top_ads
2019/05/09 20:19:52 New Prometheus metric registered: top_sources
2019/05/09 20:19:52 New Prometheus metric registered: forward_destinations
2019/05/09 20:19:52 New Prometheus metric registered: querytypes
2019/05/09 20:19:52 New Prometheus metric registered: status
2019/05/09 20:19:52 Starting HTTP server
2019/05/09 20:19:54 New tick of statistics: 648 ads blocked / 66796 total DNS querie
...
Available CLI options
# Interval of time the exporter will fetch data from PI-Hole
  -interval duration (optional) (default 10s)

# Hostname of the Raspberry PI where PI-Hole is installed
  -pihole_hostname string (optional) (default "127.0.0.1")

# Password defined on the PI-Hole interface
  -pihole_password string (optional)

# Port to be used for the exporter
  -port string (optional) (default "9311")
Available Prometheus metrics
| Metric name | Description |
|---|---|
| pihole_domains_being_blocked | This represent the number of domains being blocked |
| pihole_dns_queries_today | This represent the number of DNS queries made over the current day |
| pihole_ads_blocked_today | This represent the number of ads blocked over the current day |
| pihole_ads_percentage_today | This represent the percentage of ads blocked over the current day |
| pihole_unique_domains | This represent the number of unique domains seen |
| pihole_queries_forwarded | This represent the number of queries forwarded |
| pihole_queries_cached | This represent the number of queries cached |
| pihole_clients_ever_seen | This represent the number of clients ever seen |
| pihole_unique_clients | This represent the number of unique clients seen |
| pihole_dns_queries_all_types | This represent the number of DNS queries made for all types |
| pihole_reply | This represent the number of replies made for all types |
| pihole_top_queries | This represent the number of top queries made by PI-Hole by domain |
| pihole_top_ads | This represent the number of top ads made by PI-Hole by domain |
| pihole_top_sources | This represent the number of top sources requests made by PI-Hole by source host |
| pihole_forward_destinations | This represent the number of forward destinations requests made by PI-Hole by destination |
| pihole_querytypes | This represent the number of queries made by PI-Hole by type |
| pihole_status | This represent if PI-Hole is enabled |

